ELK Stack简介及安装手册
1、ELK Stack 简介
ELK是Elasticsearch、Logstash、Kibana的简称,这三者是核心套件,但并非全部,而且还可以添加Redis,kafka,filebeat等软件,后文的四种基本架构中将逐一介绍应用到的其它套件。
Elasticsearch:是一个分布式的实时全文搜索和分析引擎,提供搜集、分析、存储数据三大功能;是一套开放REST和JAVA API等结构提供高效搜索功能,可扩展的分布式系统。它构建于Apache Lucene搜索引擎库之上。
Logstash:是一个用来搜集、分析、过滤日志的工具。它支持几乎任何类型的日志,包括系统日志、错误日志和自定义应用程序日志。它可以从许多来源接收日志,这些来源包括 syslog、消息传递(例如 RabbitMQ)和JMX,它能够以多种方式输出数据,包括电子邮件、websockets和Elasticsearch。
Kibana:是一个基于Web的图形界面,用于搜索、分析和可视化存储在 Elasticsearch指标中的日志数据。它利用Elasticsearch的REST接口来检索数据,不仅允许用户创建他们自己的数据的定制仪表板视图,还允许他们以特殊的方式查询和过滤数据。
Filebeat:ELK 协议栈的新成员,一个轻量级开源日志文件数据搜集器,基于 Logstash-Forwarder 源代码开发,是对它的替代。在需要采集日志数据的 server 上安装 Filebeat,并指定日志目录或日志文件后,Filebeat 就能读取数据,迅速发送到 Logstash 进行解析,亦或直接发送到 Elasticsearch 进行集中式存储和分析。
2、ELK 常用架构及使用场景介绍
2.1、架构一:基础ELK架构
我们先谈谈第一种ELK架构,如图1,这是最简单的一种ELK架构方式。优点是搭建简单,易于上手。缺点是Logstash耗资源较大,运行占用CPU和内存高。另外没有消息队列缓存,存在数据丢失隐患。建议供学习者和小规模集群使用。此架构首先由Logstash分布于各个节点上搜集相关日志、数据,并经过分析、过滤后发送给远端服务器上的Elasticsearch进行存储。Elasticsearch将数据以分片的形式压缩存储并提供多种API供用户查询,操作。用户亦可以更直观的通过配置Kibana Web Portal方便的对日志查询,并根据数据生成报表
2.1.1、图一: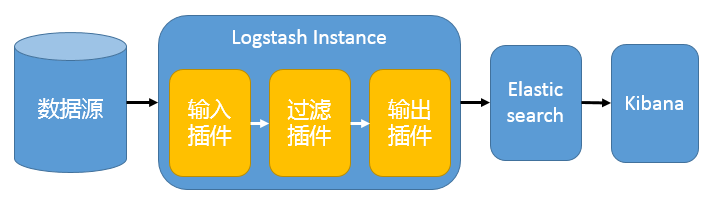
2.2、架构二:基于消息队列的架构
位于各个节点上的Logstash Agent先将数据/日志传递给Kafka(或者Redis),并将队列中消息或数据间接传递给Logstash,Logstash过滤、分析后将数据传递给Elasticsearch存储。最后由Kibana将日志和数据呈现给用户。因为引入了Kafka(或者Redis),所以即使远端Logstash,server因故障停止运行,数据将会先被存储下来,从而避免数据丢失。这种架构适合于较大集群的解决方案,但由于Logstash中心节点和Elasticsearch的负荷会比较重,可将他们配置为集群模式,以分担负荷,这种架构的优点在于引入了消息队列机制,均衡了网络传输,从而降低了网络闭塞尤其是丢失数据的可能性,但依然存在Logstash占用系统资源过多的问题。
2.2.2、图二: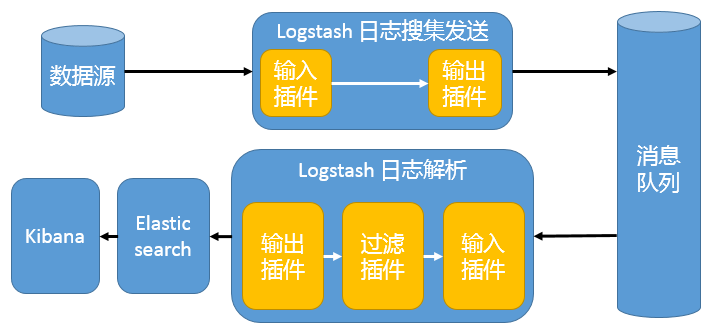
2.3、架构三:基于Filebeat架构
前面提到 Filebeat 已经完全替代了 Logstash-Forwarder 成为新一代的日志采集器,同时鉴于它轻量、安全等特点,越来越多人开始使用它。这个章节将详细讲解如何部署基于 Filebeat 的 ELK 集中式日志解决方案,具体架构见图 三。因为免费的 ELK 没有任何安全机制,所以这里使用了 Nginx 作反向代理,避免用户直接访问 Kibana 服务器。加上配置 Nginx 实现简单的用户认证,一定程度上提高安全性。另外,Nginx 本身具有负载均衡的作用,能够提高系统访问性能。
2.3.3、图三: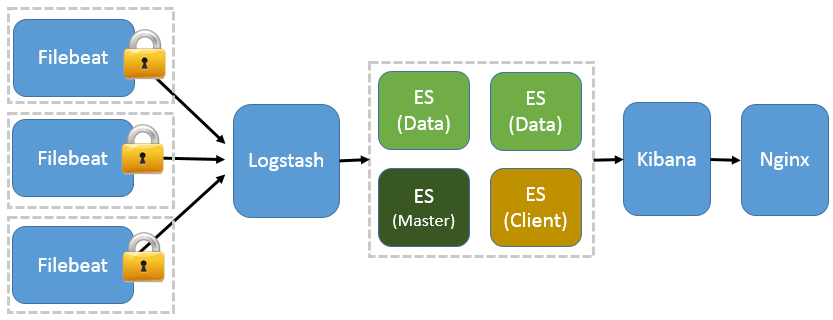
2.4、总结:
- 不管采用上面哪种ELK架构,都包含了其核心组件,即:Logstash、Elasticsearch 和Kibana。当然这三个组件并非不能被替换,只是就性能和功能性而言,这三个组件已经配合的很完美,是密不可分的。各系统运维中究竟该采用哪种架构,可根据现实情况和架构优劣而定
3、ELK主要解决了哪些生产问题?
ELK在大数据运维系统中的应用,ELK组件各个功能模块如图四所示,它运行于分布式系统之上,通过搜集、过滤、传输、储存,对海量系统和组件日志进行集中管理和准实时搜索、分析,使用搜索、监控、事件消息和报表等简单易用的功能,帮助运维人员进行线上业务的准实时监控、业务异常时及时定位原因、排除故障、程序研发时跟踪分析Bug、业务趋势分析、安全与合规审计,深度挖掘日志的大数据价值。同时Elasticsearch提供多种API(REST JAVA PYTHON等API)供用户扩展开发,以满足其不同需求
3.1、图四: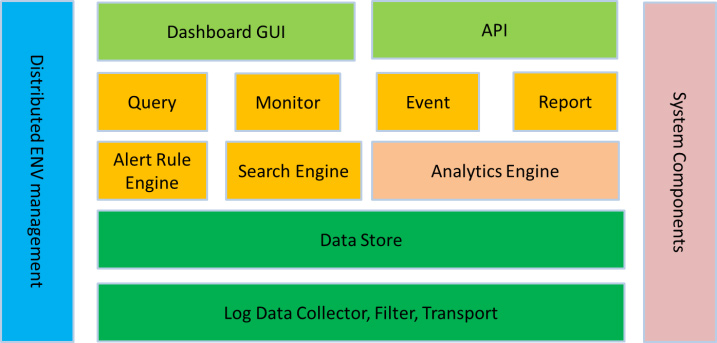
3.2、总结:
- 日志查询,问题排查,上线检查
- 服务器监控,应用监控,错误报警,Bug管理
- 性能分析,用户行为分析,安全漏洞分析,时间管理
- 综上,ELK组件在大数据运维中的应用是一套必不可少的且方便、易用的开源解决方案。
4、EFK实战之监控自定义NGINX日志
4.1、实验环境:
| 平台 | IP | 用途 | E版本 | F版本 | K版本 |
|---|---|---|---|---|---|
| CentOS 6.7 64Bit | 192.168.2.245 | Elasticsearch+Head+Kibana | 6.3.1 | 6.3.0 | |
| CentOS 6.7 64Bit | 192.168.2.246 | Elasticsearch+Head | 6.3.1 | ||
| CentOS 6.7 64Bit | 192.168.2.11 | Filebeat | 6.3.0 |
4.1.1、配置EPEL源+ELK源
1 | [root@localhost ~]# rpm -ivh http://dl.fedoraproject.org/pub/epel/6/x86_64/Packages/e/epel-release-6-8.noarch.rpm |
4.1.2、安装及配置系统环境(all_es)
1 | [root@test1 ~]# echo "* - nofile 65536" >> /etc/security/limits.conf |
4.1.3、安装Elasticsearch(all_es)
1 | [root@test1 ~]# yum install nss curl ca-certificates -y |
4.1.4、核心配置文件详解
/etc/elasticsearch/elasticsearch.yml
1
2
3
4
5
6
7
8
9
10
11
12
13
14
15
16
17
18
19
20
21
22
23
24
25
26
27
28
29
30
31
32
33
34
35
36
37
38
39
40
41
42
43# ======================== Elasticsearch Configuration =========================
#
# NOTE: Elasticsearch comes with reasonable defaults for most settings.
# Before you set out to tweak and tune the configuration, make sure you
# understand what are you trying to accomplish and the consequences.
#
# The primary way of configuring a node is via this file. This template lists
# the most important settings you may want to configure for a production cluster.
#
# Please consult the documentation for further information on configuration options:
# https://www.elastic.co/guide/en/elasticsearch/reference/index.html
#
# ---------------------------------- Cluster -----------------------------------
#集群名称,所有节点的集群名称需要一致
cluster.name: lisir
#本机节点名称
node.name: efk-one
# ----------------------------------- Paths ------------------------------------
#数据存放目录
path.data: /data/es-data
#日志存放目录
path.logs: /var/log/elasticsearch
# ----------------------------------- Memory -----------------------------------
#配置内存使用用交换分区
bootstrap.memory_lock: false
# ---------------------------------- Network -----------------------------------
#监听的网络地址
network.host: 0.0.0.0
#开启监听的端口
http.port: 9200
# --------------------------------- Discovery ----------------------------------
#集群内其他节点IP地址,(9300端口是节点内选举所用端口)
discovery.zen.ping.unicast.hosts: ["192.168.2.245:9300", "192.168.2.246:9300"]
#为了防止数据丢失,配置discovery.zen.minimum_master_nodes非常重要,使每个适合主的节点都知道要形成集群必须可见的适合主的节点的最小数目:(master_eligible_nodes / 2) + 1,换句话说,如果有三个主合格节点,那么最小主节点应该设置为(3/2)+1或2:
discovery.zen.minimum_master_nodes: 2
# ---------------------------------- outher -----------------------------------
#如果要使用head,那么需要增加新的参数,使head插件可以访问es
#开启跨域访问支持,默认为false
http.cors.enabled: true
#跨域访问允许的域名地址,(允许所有域名)以上使用正则
http.cors.allow-origin: "*"
#此配置解决报错“system call filters failed”
bootstrap.system_call_filter: false/etc/elasticsearch/jvm.options
1 | ## JVM configuration |
- /etc/elasticsearch/log4j2.properties
1 | #配置RollingFile输出源 |
4.1.5、安装elasticsearch-head
1 | [root@test1 ~]# yum install -y npm |
4.1.6、安装kibana
1 | [root@test1 ~]# yum install kibana |
4.1.7、kibana核心配置文件详解
1 | # 默认值 : 5601 Kibana 由后端服务器提供服务。此设置指定要使用的端口 |
4.1.8、Filebeat概述:
Filebeat是一个日志文件托运工具,在你的服务器上安装客户端后,filebeat会监控日志目录或者指定的日志文件,追踪读取这些文件(追踪文件的变化,不停的读),并且转发这些信息到elasticsearch或者logstarsh中存放。以下是filebeat的工作流程:当你开启filebeat程序的时候,它会启动一个或多个探测器(prospectors)去检测你指定的日志目录或文件,对于探测器找出的每一个日志文件,filebeat启动收割进程(harvester),每一个收割进程读取一个日志文件的新内容,并发送这些新的日志数据到处理程序(spooler),处理程序会集合这些事件,最后filebeat会发送集合的数据到你指定的地点。如图五:
4.1.9、图五: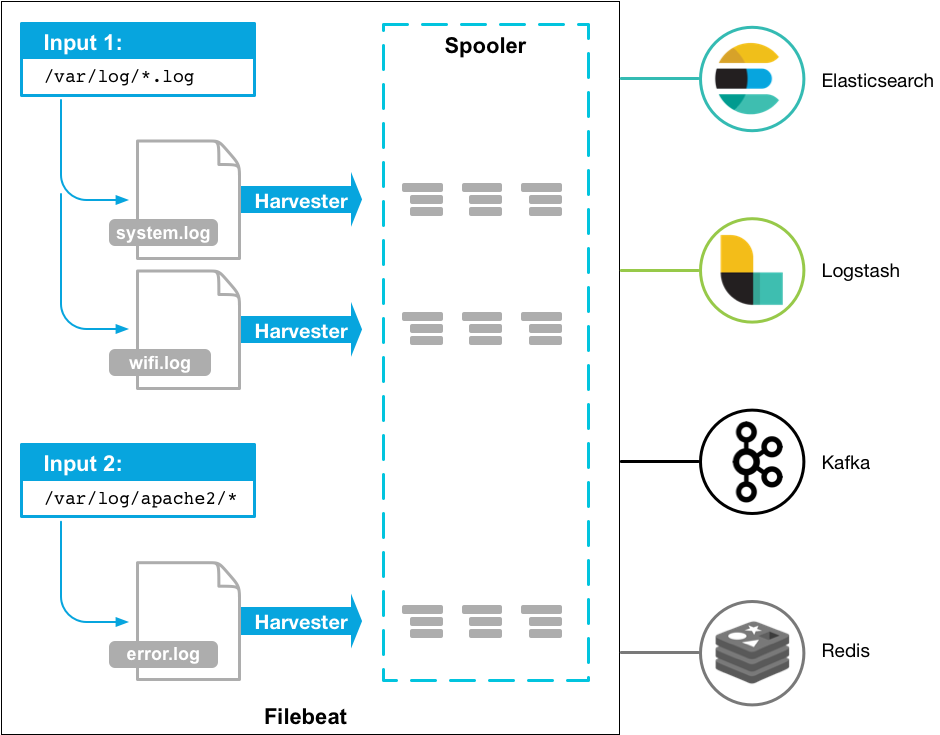
4.1.10、安装Filebeat
1 | [root@test1 ~]# curl -L -O https://artifacts.elastic.co/downloads/beats/filebeat/filebeat-6.3.0-x86_64.rpm |
4.1.11、主配置文件详解:/etc/filebeat/filebeat.yml
1 | #======= Filebeat modules ======= |
4.1.12、开启filebeat nginx 模块,支持过滤日志
1 | [root@test1 ~]# filebeat modules enable nginx |
4.1.13、载入filebeat自带的仪表盘和可视化代码,通过kibana展示
1 | [root@test1 ~]# filebeat setup --dashboards |
4.1.14、修改filebeat nginx模块配置文件,input数据
1 | [root@test1 ~]# vim /etc/filebeat/modules.d/nginx.yml |
4.1.15、修改filebeat nginx模块access默认配置文件用来匹配自定义日志
1 | #获取自定义NGINX日志格式 |
4.1.16、修改filebeat nginx模块error默认配置文件用来解决时区问题
1 | [root@test1 ~]#vim /usr/share/filebeat/module/nginx/error/ingest |
4.1.17、启动filebeat,观察日志
1 | [root@test1 ~]# service filebeat start |
5、相关手册整理
官方文档:Elastic Stack and Product Documentation
官方文档:关于Load the index template in Elasticsearch
Logstash收集nginx日志之使用grok过滤插件解析日志